Politics · Federal General Election 2006 · Canada
Introduction
Polls across Canada were open on 2006-01-23-Monday for a federal general election. The result was a minority victory for the 'not Liberal' Conservative Party. Until Canada catches up with the world's electoral best practices of the 20th Century (such as proportional representation: see below), a minority is probably the best we could have hoped for.
The outcome was seen as a rebuke of a Liberal government perceived as tired and plagued by corruption, with government leadership shifting from the centrist Liberals to the socially conservative Conservatives. Conservative Party Deputy Leader Peter MacKay said, "minority means we have to be constructive" (source: BBC), which raises the question of what a majority would have meant to the Conservatives.
With this being the second minority result in as many elections, the sails of national electoral reform may find some wind. For the second election in a row, the Green Party was alone amongst the parties fielding national slates to be shut out of Parliament, showing only slight growth in popularity from the 2004 election.
Actual Results vs. a Proportional Model
Allocation of seats in the House of Commons, based on the election results:


Allocation of seats in the House of Commons as it would be:


The model shown is an assignment of available House of Commons seats per the Sainte-Laguë method with a cut-off of 2%, i.e., parties that received less than 2% of the popular vote are not assigned seats in the House; these fractions of seats (e.g., four hundredths of a seat) that cannot readily be assigned to fringe parties are allocated amongst the major parties. The 2% cut-off was selected to match the threshold for public funding of political parties. While Sainte-Laguë method is used by some modern democracies, its use here is simply to illustrate how different the outcome of the election might be in the House, not to suggest that this is necessarily the best method for Canada. Other proportional methodologies may yield slightly different results (see research at Elections Canada or the Canadian Library of Parliament, or an example in New Zealand).
This model highlights the diminished House of Commons clout of a party with limited regional appeal (e.g., the BQ), and the increase in representation for alternative national parties (e.g., the Green Party, elevated to Official Party status) which have significant support that is diffusely spread across electoral districts and hence does not lead to the election of any candidates in particular ridings in the first-past-the-post system. Because electoral districts in Canada have at most 0.48% of the electors, and candidates run in only one district, it is highly unlikely (practically impossible) that any un-affiliated candidate could accumulate enough votes to meet the 2% threshold.
See also similar illustrations based on the 2000, 2004, 2008, and 2011 elections.
| Party | Colour | Actual Votes | Actual Seats | Actual Seats Fraction | Actual Official Party? | Prop. Seats | Prop. Seats Diff | Prop. Official Party? |
|---|---|---|---|---|---|---|---|---|
| Animal Alliance Environment Voters | <0.01% | 0 | 0 | No | 0 | 0 | No | |
| Bloc Québécois |  |
10.48% | 51 | 16.56% | Yes | 33 | -18 | Yes |
| Canadian Action | 0.04% | 0 | 0 | No | 0 | 0 | No | |
| Christian Heritage | 0.19% | 0 | 0 | No | 0 | 0 | No | |
| Communist | 0.02% | 0 | 0 | No | 0 | 0 | No | |
| Conservative |  |
36.27% | 124 | 40.26% | Yes | 113 | -11 | Yes |
| First Peoples National | 0.01% | 0 | 0 | No | 0 | 0 | No | |
| Green |  |
4.48% | 0 | 0 | No | 14 | +14 | Yes |
| Liberal |  |
30.23% | 103 | 33.44% | Yes | 94 | -9 | Yes |
| Libertarian | 0.02% | 0 | 0 | No | 0 | 0 | No | |
| Marijuana | 0.06% | 0 | 0 | No | 0 | 0 | No | |
| Marxist-Leninist | 0.06% | 0 | 0 | No | 0 | 0 | No | |
| New Democratic |  |
17.48% | 29 | 9.42% | Yes | 54 | +25 | Yes |
| Progressive Canadian | 0.10% | 0 | 0 | No | 0 | 0 | No | |
| Western Block | 0.01% | 0 | 0.00% | No | 0 | 0 | No | |
| No Affiliation |  |
0.55% | 1 | 0.32% | No | 0 | -1 | No |
Note: Official party status is granted to parties that secure at least 12 seats. It confers certain standing in parliamentary procedure and funding for parliamentary staff.
Source: Elections Canada Official Results; 14 908 703 ballots cast by the pool of 23 054 615 electors, for a turnout of 64.67%, an increase of almost 4 points over the previous general election (60.91%).
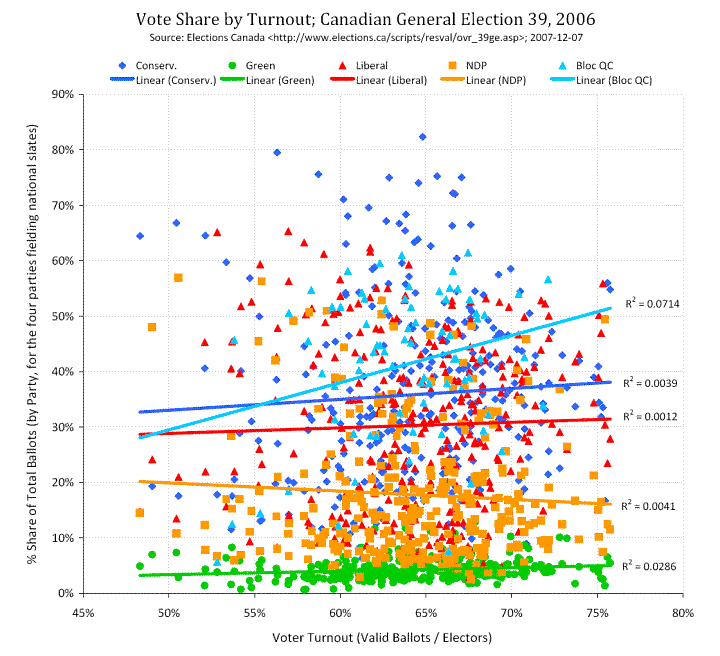
Vote Share by Turnout
Following Joseph Petviashvili's translation to English of a chart of results from the Russian Parliamentary election of 2007, comparing vote share by party to voter turnout, I did a similar exercise for this Canadian general election. My own chart includes only the four parties that fielded national slates, plus the largest regional party (by votes); each data point represents one party·riding. This chart is also available as a .PDF.


